How to Report Vulnerability Risk to Executives and the Board: Dashboards, Metrics & Best Practices
by Brad Hibbert, COO & CSO//13 min read/

Vulnerability management reporting is one of the most important — and most difficult — tasks facing security leaders today. Boards and executives expect regular updates that clearly communicate risk, progress, and accountability. But translating vulnerability data into meaningful business insights requires more than just dashboards.
In this post, we explore best practices for board-level cybersecurity reporting and outline the reporting and dashboarding capabilities to look for in a unified vulnerability management solution.
Common Pitfalls in Cybersecurity Reporting
Before we explore the capabilities to aim for, let’s cover the common reporting pitfalls that hold most teams back:
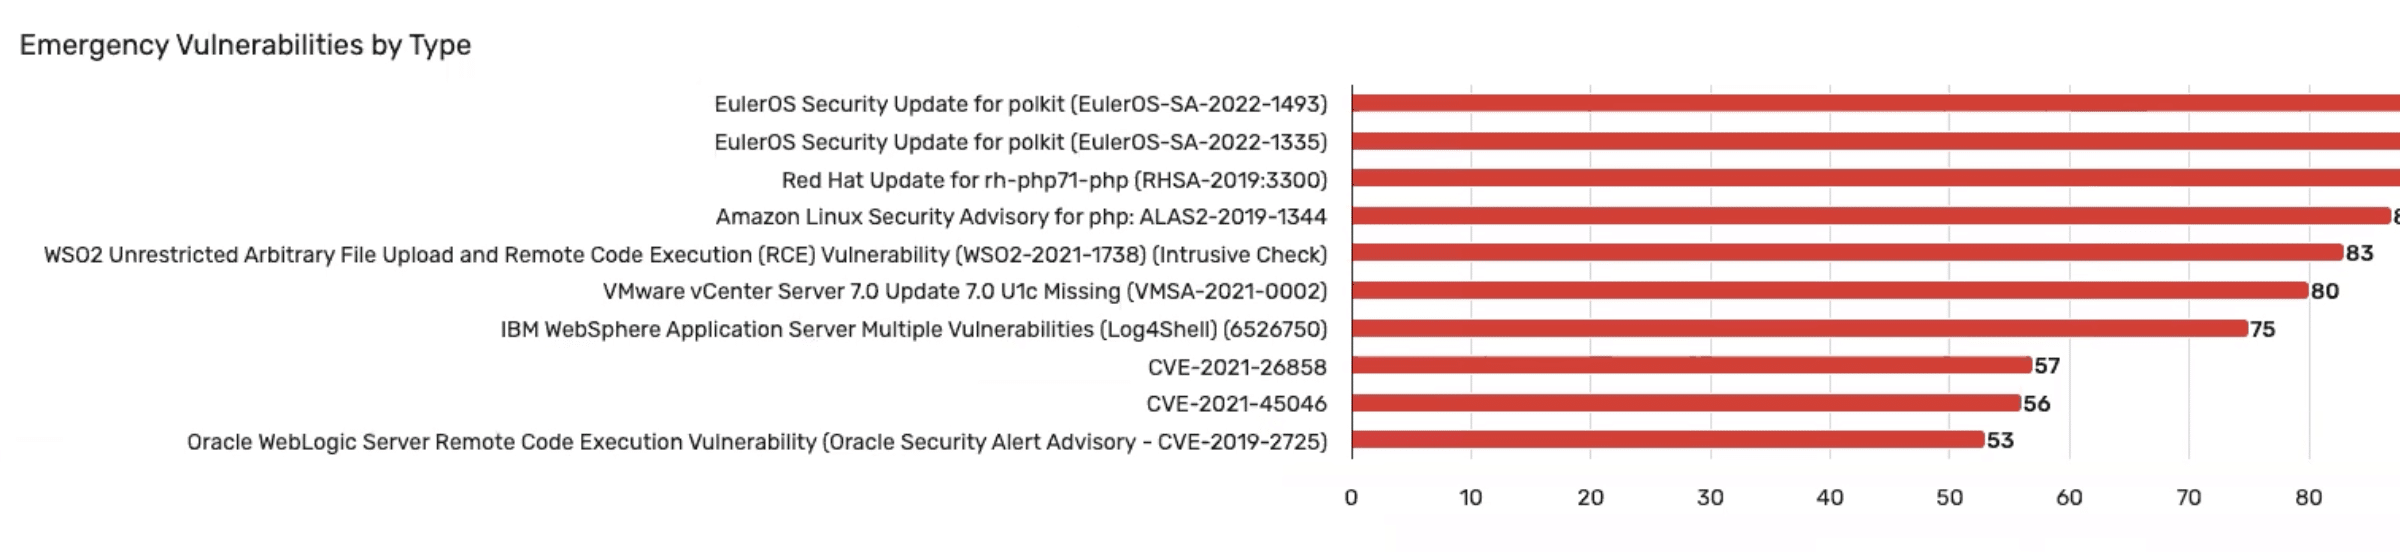
- Overloading with technical detail: CVEs, asset lists, and patch IDs often dominate reports, making them unreadable for non-technical stakeholders.
- Siloed data sources: Without centralized visibility, it’s hard to build a consistent or accurate picture of risk.
- Lack of confidence in data accuracy: Security leaders often struggle to stand behind the numbers when reports are built from multiple disconnected sources. Inconsistent or conflicting data undermines trust — especially in boardroom settings.
- Manual reporting processes: Static reports created in Excel or PowerPoint are error-prone and quickly outdated.
- Lack of business alignment: When reports don’t connect cyber risk to financial or operational impact, they fail to inform strategy.
Avoiding these pitfalls starts with having the right capabilities built into your unified vulnerability and exposure management platform.
What the Board Wants to See
Boards and executive teams aren’t looking for CVE counts or overly technical vulnerability reports. They want:
- Clarity on business risk: What’s at stake operationally and financially?
- Proof of progress: Are we improving our risk posture over time?
- Confidence in controls: Are we compliant? Are we resilient?
To deliver that value at the executive level, vulnerability and risk reports must focus on:
- Business-aligned risk summaries: Map technical risk to business services and functions.
- Quantified risk posture: Show metrics like critical vulnerabilities, risk scores, and potential financial exposure.
- Remediation and progress trends: Demonstrate reductions in vulnerabilities over time.
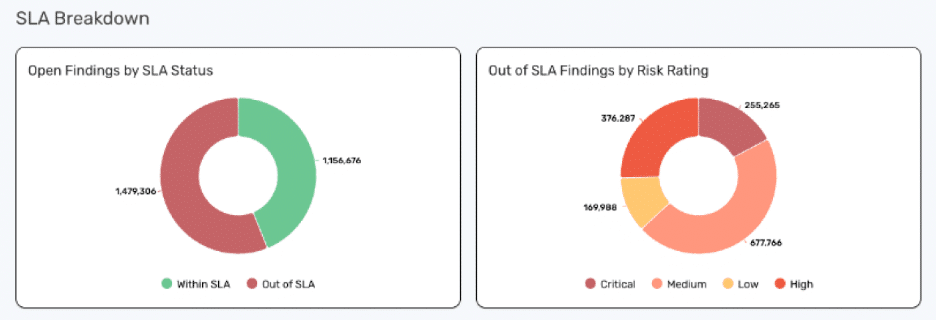
- SLA/exposure heat maps: Highlight risks outside defined thresholds.
- Compliance dashboards: Track status against frameworks like PCI, ISO, and NIST.
- Investment impact: Show how cybersecurity initiatives reduce business risk and support strategic goals.
Security leaders must bridge the gap between technical telemetry and strategic insight. These elements give leadership the context they need to make informed decisions — and that’s where the right reporting tools come in.
7 Capabilities Every Vulnerability Management Reporting Solution Should Offer
Here are the core reporting and dashboard capabilities every unified vulnerability and exposure management platform should provide:
1. Executive-Level Dashboards
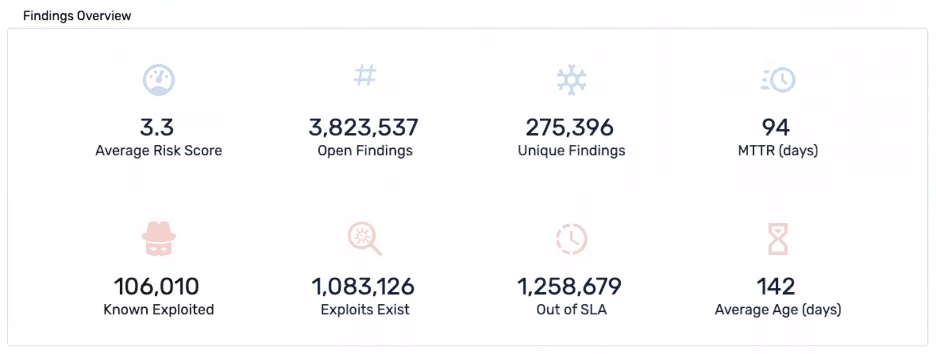
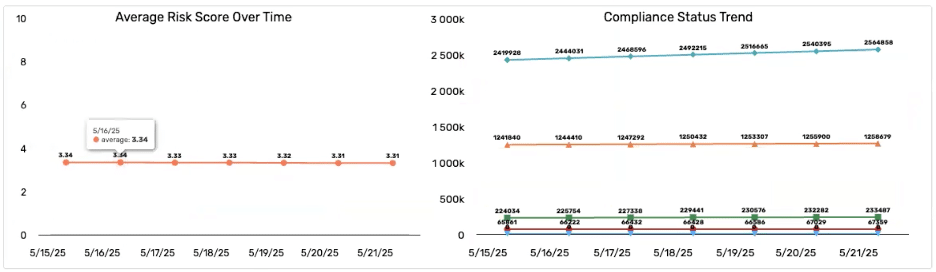
Dashboards should start with a high-level summary of organizational risk: open vulnerabilities by age and severity, average risk score, MTTR, SLA compliance, and trend lines. Look for solutions that offer prebuilt executive dashboards with visual summaries like donut charts, trend lines, and SLA metrics.
2. Role-Based Views and Access
Different stakeholders need different views. Look for platforms that support personalized dashboards and role-based access control to ensure each user sees relevant information tied to their responsibilities.
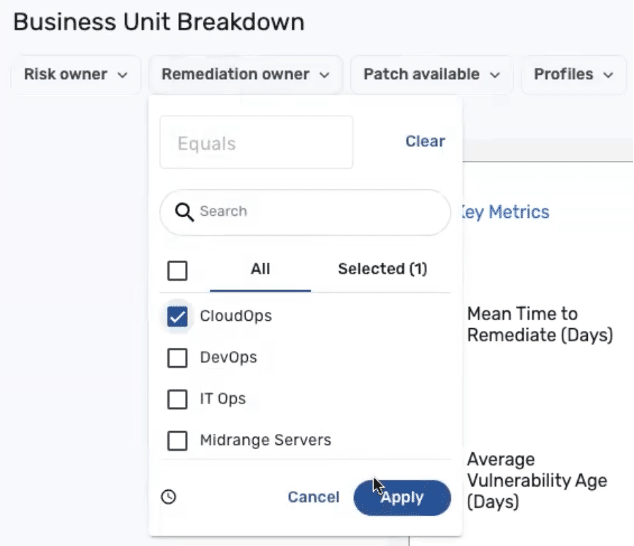
3. Granular Filtering and Drilldowns
Reports should support dynamic filtering — by vulnerability type, asset group, business service, and other dimensions — to uncover context behind top-line metrics.
4. Progress Over Time
The ability to display trends in MTTR, patching velocity, or risk posture over time is critical for showing progress to the board. These trends are most impactful when grounded in a clear vulnerability prioritization strategy that helps focus remediation on the risks that matter most.
5. Compliance Reporting and Framework Alignment
Effective solutions provide reporting aligned to frameworks like ISO 27001 and NIST 800-53. Look for dashboards that track scan coverage, control gaps, and progress toward compliance.
6. Benchmarking and Comparative Insights
Dashboards should support comparisons between business units, geographies, or asset groups, relative to SLAs or defined risk appetites. Benchmarking provides essential context for board reporting — helping leaders understand whether the organization is performing better, worse, or on par with peers. This broader perspective is critical for assessing program maturity and demonstrating competitive standing.
7. Fast, Flexible Report Creation
The best platforms enable teams to quickly create or clone dashboards, select from various visualization types, and export reports in multiple formats (e.g., PDF, CSV). No BI expert required.
Using Reporting to Monitor SLA Performance — Internally and with Service Partners
For many organizations, measuring performance against service-level agreements (SLAs) is one of the most critical reporting functions. Whether vulnerability scanning and remediation are handled by internal teams or external partners, security leaders need reliable data to validate that commitments are being met.
Organizations can use unified vulnerability and exposure management (UVEM) platforms to track and report on key performance metrics like mean time to remediate (MTTR), remediation throughput, and SLA adherence. Customers use UVEM dashboards to monitor activity — verifying that patches are applied, tickets are resolved within timeframes, and risk is decreasing across priority systems.
This level of visibility fosters accountability, improves vendor relationships, and ensures executive stakeholders can trust that remediation efforts are keeping pace with risk.
What Brinqa Reporting Looks Like in Action
The Brinqa UVEM platform delivers on all the reporting capabilities outlined above — and enables teams to present data with clarity, context, and business relevance. By centralizing and normalizing data from across your security ecosystem, Brinqa ensures that reporting is based on accurate, consistent, and up-to-date information. This gives security teams the confidence to present to company leadership without scrambling to reconcile conflicting data sources.
Here are a few examples of the reports and dashboards Brinqa provides out of the box:
- Executive Dashboards: High-level views showing average risk scores, compliance posture over time, and SLA exceedance.
- Team-Level Views: Dashboards segmented by remediation owner, showing open vulnerabilities, remediation age, and ticket status.
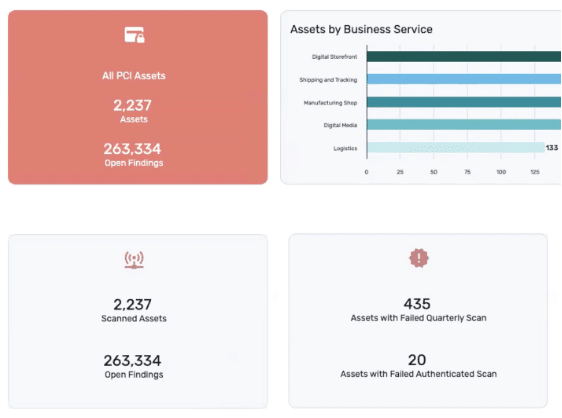
- Compliance Reports: Visualizations for scan coverage, audit readiness, framework mapping (PCI, ISO, etc.), and remediation tracking.
Brinqa dashboards are fully customizable and support both visual and query-based configuration using our own Brinqa Query Language (BQL) or the Explorer tool in the platform. Reports can be exported, copied into presentations, or ingested into third-party BI tools via API or OLAP integrations.
Advanced Customization: Tailor Risk Scoring and Reporting to Your Business
Every organization has unique risks, structures, and reporting needs. Customization ensures that dashboards and scoring models reflect how your organization views and prioritizes risk — making reports meaningful to both technical and executive audiences.
Brinqa enables users to create or clone scoring models and dynamically adjust risk based on factors such as CVSS, EPSS, asset criticality, data sensitivity, compliance scope, and business function. Conditional logic can be applied using attributes like IP ranges, naming conventions, and data source metadata—without requiring manual tags.
The platform also supports deep customization of dashboards and widgets. Users can build reports visually using a natural-language-like interface in Explorer or apply advanced logic with BQL. Layouts, formats, and filters are fully configurable to deliver role-specific insights across security, compliance, and operations teams—an essential capability for supporting a risk-based vulnerability management approach.
5 Best Practices for Board-Ready Security Reporting
- Speak in business terms: Link vulnerabilities to financial, operational, and compliance risks.
- Prioritize outcomes: Show progress on metrics that matter, not just activity volume.
- Simplify the message: Use visuals, filters, and KPIs that are easy to understand.
- Align with strategic goals: Highlight how security supports broader initiatives.
- Be proactive, not reactive: Frame reporting around continuous improvement, not just incidents.
Frequently Asked Questions (FAQ)
What is vulnerability management reporting?
Vulnerability management reporting is the process of tracking, analyzing, and communicating cyber risk — typically through dashboards, metrics, and trend data. Reports are used to guide remediation efforts and inform stakeholders, including executive leadership and the board.
What should a board-level cybersecurity report include?
A strong board report should highlight the business impact of cyber risk. This includes metrics like critical vulnerabilities by business unit, SLA adherence, risk trends over time, and progress against remediation efforts. It should also include compliance status and alignment with key regulatory frameworks.
What does the board really want to understand from cyber risk reports?
Boards don’t just want numbers — they want meaning. They need to know whether the organization is improving, how it compares to peers, and whether the current risk posture is acceptable. Contextualized metrics like risk trends, SLA performance, and benchmarking help translate data into decisions.
How often should vulnerability risk be reported to the board?
Quarterly reporting is common, but high-risk or fast-moving organizations may require more frequent updates. The cadence should reflect the organization’s risk appetite and regulatory obligations.
How should we report on major vulnerabilities like MOVEit or Citrix Bleed?
Boards often ask about high-profile “celebrity vulnerabilities” like MOVEit, Citrix Bleed, or F5 BIG-IP exploits. Scenario-based reporting can help security leaders identify and explain where they were exposed, what actions were taken, and what controls are in place to prevent recurrence — demonstrating both visibility and program maturity.
What metrics demonstrate remediation progress effectively?
Key metrics include mean time to remediate (MTTR), patching velocity, percentage of vulnerabilities resolved within SLA, and reductions in high-risk findings over time. Visualization of these trends helps boards understand trajectory.
How can we translate technical vulnerabilities into business impact?
Mapping vulnerabilities to critical assets, business services, or revenue-generating systems helps illustrate potential operational or financial consequences. Risk scoring models should reflect business context, not just CVSS.
How should compliance be reported alongside risk?
Dashboards should show coverage and gaps across applicable frameworks like PCI DSS, ISO 27001, or NIST 800-53. Boards want to see both current posture and progress toward resolving control deficiencies.
Turn Chaos into Clarity
With increasing pressure from leadership and regulators, reporting can no longer be an afterthought. Security leaders need to deliver insights that drive decisions.
Brinqa helps you make the leap from raw data to real impact — enabling your teams to prioritize what matters, act faster, and communicate results with confidence.
See how Brinqa transforms reporting for security leaders. Request a demo today.