All the World's a Graph: Attack Paths Beyond CVSS
by Brad Hibbert, COO & CSO//
Why Reachability, Exploitability, and Blast Radius Beat the CVSS League Table, and How You Actually Get the Data
I ended my last blog on validation with a confession. Everything in it, the noise reduction rate, the crown jewel coverage number, the tiered budget, assumed you already knew what your attack paths were. Here I want to deal with that assumption directly: how you actually find the paths, keep the inventory current, and use it to decide what matters, instead of falling back on a severity list that everyone already agrees is misleading.
Because that's really what's happening when a team runs vulnerability prioritization off the CVSS score. It isn't that anyone believes severity equals risk. It's that severity is what's sitting right there in the scanner output, and reachability, exploitability, and blast radius are harder to get. So teams default to the league table, not because it's right, but because it's available. That excuse is getting weaker every quarter, especially now that the newest models can read code, configuration, and identity relationships well enough to make a real attempt at the harder questions. Call it a post-Mythos world if you like.
Three questions, not one score
In exposure management, a CVSS score answers one question: assuming ideal conditions, how bad is this vulnerability in the abstract. That's a useful, stable, comparable number, and it's also the wrong number to sort a backlog by, because it doesn't know anything about your environment. Three other questions do the actual work of turning severity into risk.
Exploitability asks whether this specific weakness can actually be triggered given the conditions on this specific asset. Is the vulnerable service even running? Does the exploit need a privilege level nobody has? Is there a public proof of concept or is this theoretical? Exploitability is about the weakness itself.
Reachability asks whether an attacker starting from a plausible position can actually get to that weakness at all. A critical flaw on a service bound to an internal interface, sitting behind three network hops and an authentication gate, is not reachable the way the same flaw would be on a service exposed to the internet with no login required. Reachability is about the path to the weakness, not the weakness itself.
Blast radius asks what happens after. If this gets exploited, how far does it spread, and what does it touch on the way. A forgotten internal admin panel and a load balancer that quietly talks to a dozen production services can carry the same CVSS score and the same exploitability profile, and still represent a completely different risk, because one of them is a dead end and the other is a highway.
Put an exposure through all three questions and you often get a very different answer than the score alone would suggest. A 9.8 on an unreachable, isolated system with no path to anything of value can rank below a 6.5 that sits on the one route into your identity provider. That isn't a controversial idea anymore. Most practitioners nod along to it immediately. The argument was never really about whether this is true. It's about whether you can actually get the data to act on it.
A 9.8 on an unreachable, isolated system with no path to anything of value can rank below a 6.5 that sits on the one route into your identity provider.
Why Can't Attack Path Data Wait for a Quarterly Refresh Anymore?
Attack path data needs to stay current because attackers, increasingly assisted by AI, can find and exploit a disclosed vulnerability within days of it going public. A quarterly refresh can't catch a gap that closes that fast.
None of this would carry much urgency if attackers were still moving at the old pace. They aren't. The same kind of model that can read your configs and correlate your asset data can also read a disclosed vulnerability, work out how to exploit it, and chain it into existing attack tooling faster than a human team used to manage on its own. The time between a vulnerability going public and someone actually attempting to exploit it against exposed systems keeps shrinking. A quarterly refresh of your attack path data used to be defensible. It isn't anymore, because the gap between reachable in theory and actually being probed can now close in days, sometimes less.
That's the real reason to treat reachability, exploitability, and blast radius as living data instead of a report generated for a meeting. A graph that's accurate but three months old describes a world that moves slower than the one you're actually in. The programs that hold up are the ones that keep the graph current the way they'd keep a production system current, updated continuously, not audited on a schedule.
A graph that's accurate but three months old describes a world that moves slower than the one you're actually in.
Where does the attack path data actually come from?
There are three approaches to understanding how attackers could move in your environment, each with a different impact:
- The first is to build the network topology directly and keep rebuilding it. Instrument the environment thoroughly enough: agents, flow logs, cloud API polling, identity directory syncs, CMDB reconciliation, that you have observed, create a true picture of what talks to what, who can log into what, and which segments actually separate which assets. This is the most trustworthy source of reachability and blast radius data there is, because you aren't guessing, you're watching. The problem is cost and decay. Enterprise environments change by the week, sometimes by the hour, a new service account here, a firewall rule change there, a cloud resource spun up for a project that never gets torn down. Full topology instrumentation at that pace is expensive to build, expensive to maintain, and even then it's rarely complete, because some of the inputs, for example a third party VPN, a forgotten jump host, a stale credential, don’t show up cleanly in any single feed.
- The second is to infer the likely paths from the data you already have. Rather than directly observing every connection, have a model reason over what is known: asset roles, exposed services, communication patterns that you do have telemetry for, identity and privilege signals, and estimate the probability that a path exists and what it would mean if it were used. This is roughly what Brinqa's upcoming AI Exploitability Agent is built to do. It extends the existing asset and exposure graph with attack path modeling, continuously reevaluating exploitability and reachability as new evidence arrives, rather than waiting for a full network rebuild. The tradeoff runs the other direction from direct observation. It's faster and cheaper to keep current, but it's probabilistic, so every inferred path needs to carry a confidence level, and thin evidence should pull the estimate toward a conservative middle instead of a confident extreme in either direction.
- The third is to point an AI reasoning engine directly at a subset of assets, usually the ones worth the expense, and have it build and test paths live, the way a red team would, but continuously. This is what autonomous pentesting tools already do in production, and it's a working approach today, not a hypothetical. Scoped to a defined set of high value assets, it gives you the same live discovery and reasoning a full network rebuild would, without trying to instrument an entire estate.
None of these three options works well alone. Direct observation gives you grounded truth wherever you can afford to build it, for example your crown jewel segments, your identity infrastructure, or the handful of systems where being wrong is expensive. Inference over a curated graph gets you reasonable coverage everywhere else, and keeps pace with an environment that changes faster than any manual rebuild can track. And a live AI reasoning engine earns its place on the subset of assets worth the cost of running it continuously. The practical setup treats observed connections as high confidence facts, treats inferred ones as estimates with a visible confidence score attached, and treats live tested paths as the strongest confirmation of all, because they were actually run, not guessed.
A path with low inferred confidence isn't useless, it's a candidate worth validating, the same idea I raised in my last blog on validation. Paths flagged as likely but unconfirmed belong at the top of the validation backlog. Not because you're sure they're real, but because you're not sure yet, and that uncertainty is the most useful signal your prioritization process has.
Two more techniques are worth a quick mention, though neither is a fourth way to build the graph, they're ways to sharpen the one you already have. Threat intelligence can check a path instead of building it from scratch. Take the sequence of a specific adversary group actually used against other victims, and match it against paths already sitting in your graph. A path stops being merely plausible and becomes a path someone is actively using right now, which is exactly the kind of signal that should jump a path to the front of the queue. Incident replay does the same job, but with a narrower scope. Instead of general threat intelligence, it uses an attack your own organization already experienced, replayed from IR and forensics data, to confirm that the exact path is actually closed now, not probably closed.
How do autonomous pentesting tools build attack paths?
The third approach above isn't hypothetical, it's already how some tools work in production. Autonomous pentesting platforms like Horizon3.ai's NodeZero, and similar tools build the graph live during the test itself, rather than working off a pre-existing map. NodeZero starts by scanning and fingerprinting the network itself, the way a human tester's reconnaissance phase would, then applies graph based reasoning to build what it calls a cyber terrain map, planning attack paths based on what it actually sees rather than what it's told. As it gains footholds, it re-prioritizes in real time, correlating signals like Active Directory metadata and hostnames to steer toward domain controllers and other high value targets. This is direct observation and live reasoning happening together, during test execution, against your actual environment, and it gets rebuilt fresh each time the test runs rather than standing between tests.
That's a different animal from breech and attack simulation tools, which plays a fixed library of known techniques against your controls on a schedule instead of mapping your specific network fresh each run. Both have a place. One tells you whether known techniques still get caught. The other tells you what an attacker could actually chain together right now.
None of this replaces a standing graph like Brinqa's, and it isn't supposed to. Brinqa's job is to maintain the picture between tests, continuously inferring and prioritizing paths from the data that's already flowing in, so a team knows where to look before anyone runs anything. A tool like NodeZero is how you get grounded truth confirmation of the paths that matter most, which is exactly the validation stage of a CTEM program I wrote about earlier in this series. That's also why Brinqa partners with and connects into platforms like Horizon3 instead of trying to replace them. The inferred graph tells the test where to point. The test result feeds back in as a confirmed, high confidence edge in the graph instead of an estimate.
Which attack path approach fits your organization?
The split looks different by company size, but the same pattern shows up at each one.
Smaller organizations lean almost entirely on inference, since they're already generating scanner output, cloud posture data, and identity data for other reasons. A full topology rebuild or a continuously running reasoning engine is out of reach across a whole estate, so most layer in an autonomous pentest occasionally, as an event, not standing infrastructure.
Mid sized organizations split by asset value, the same tiering I argued for with the validation budget. Inference stays the backbone because it's the only thing that scales at a reasonable cost, but a crown jewel subset gets a live AI reasoning engine run often, sometimes continuously, since that's affordable well before instrumenting the whole network live. Full topology rebuild stays rare, reserved for a handful of high compliance segments.
Large enterprises already sit on most of what a rebuild would produce, just scattered across CMDBs, cloud inventories, identity systems, and a dozen scanners, so normalizing and inferring over what exists beats fresh collection. What grows with size is how large a crown jewel subset can justify a continuously running reasoning engine, with people reviewing flagged paths before anyone acts. Full grounded truth rebuilds stay reserved for the few segments where a wrong answer is existential, core banking, identity infrastructure, operational technology, not the estate as a whole.
Inference is the backbone at every size. What changes is how big a slice gets the expensive treatment, not whether anyone builds the whole network live.
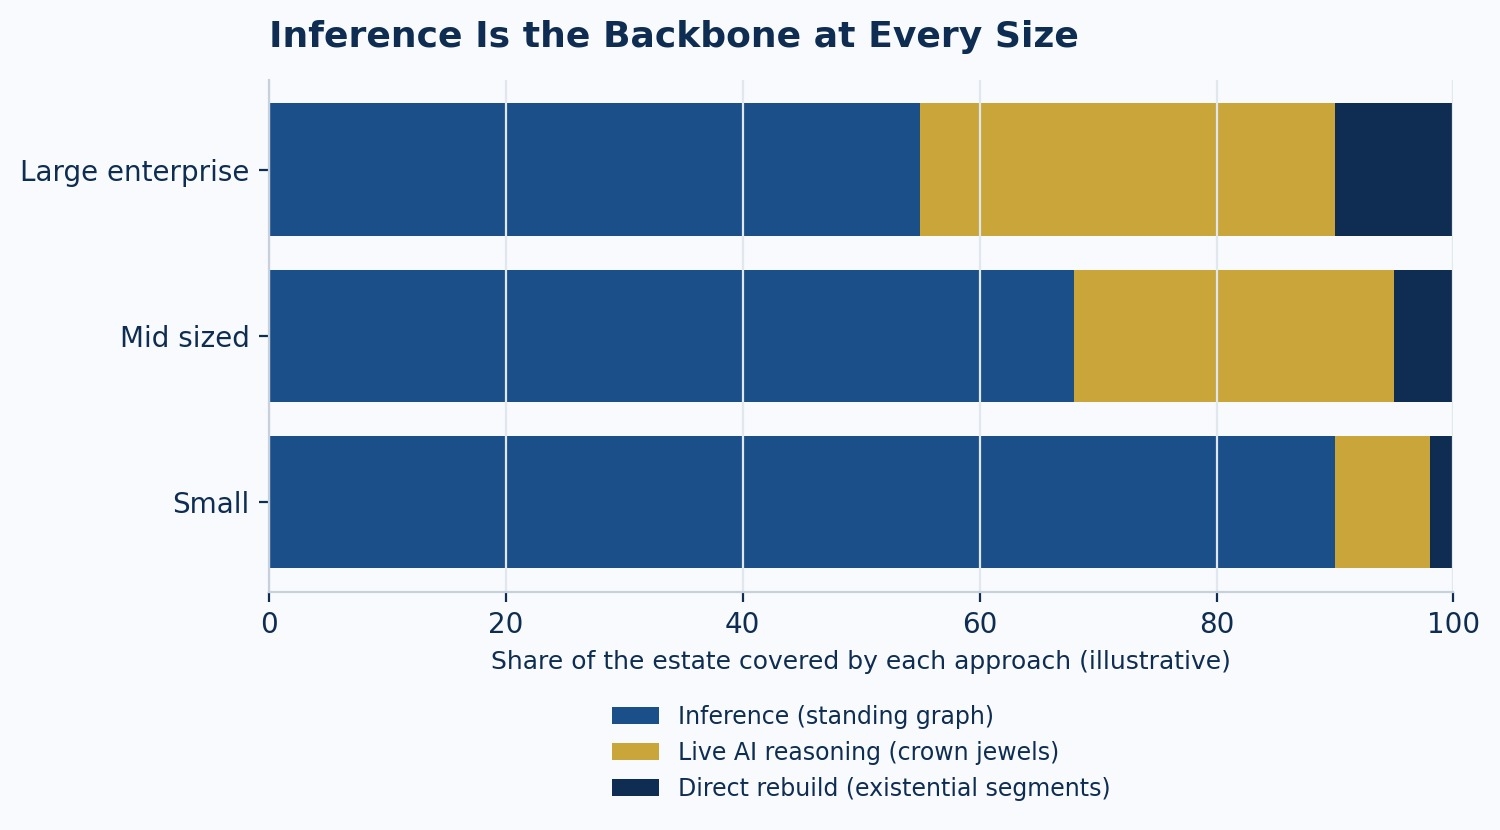
Illustrative mix, not measured data: how the three approaches likely split by company size.
The market is moving fast
This isn't a slow corner of security right now. New product announcements around attack path insight and exploitability are showing up close to weekly. especially in the run-up to Black Hat USA 2026 in early August. A few examples:
- Bitdefender rebuilt the Attack Path feature in GravityZone around its EDR and XDR telemetry, directly observing how an attacker could chain exposures across assets and accounts to reach a critical target, a clean example of the direct observation approach (June 16, 2026).
- CrowdStrike's Predictive Path Analysis inside Falcon Exposure Management runs on its agent based Threat Graph, endpoint and cloud telemetry doing the same direct observation job inside a second major platform (seen July 2026).
- VulnCheck's Initial Access Intelligence work reasons over vulnerability and exploit data it already has to flag a practical chained attack path, like pairing an automation platform RCE with a separate authentication bypass, without ever touching a customer's live network, inference in its purest form (week of July 20, 2026).
- Rapid7 shipped updates to Exposure Command and Surface Command that let teams see attack surface relationships by querying data already being collected, the same inference logic, just easier to reach (June 2026 release notes).
- AWS Continuum, launched June 17, 2026, puts the third approach to work directly. Its AI reasoning agents scan an environment to build an attack path map, then construct working exploit proofs of concept in a sandbox to confirm which paths are real before recommending a fix, live testing rather than a scripted library or inference alone.
None of this is a coincidence. Between these five, all three approaches I described above are already shipping in production. Severity alone stopped being enough, and nearly everyone building in this space right now is racing to answer the same three questions: what's exploitable, what's reachable, and what does it touch.
What to do now, and what to watch over the next year
For a program still ranking its backlog by severity, moving from lists to paths doesn't have to start with a big rebuild. A few things are worth doing now:
- Tag your crown jewel assets first, and build the graph outward from them instead of trying to map everything at once.
- Connect whatever partial graph you already have, asset inventory, identity data, network flow logs, to your exposure data rather than waiting for a complete topology project that will always be a year away.
- Route the paths your inference flags as likely but unconfirmed straight into your validation backlog, so uncertainty turns into action instead of sitting in a dashboard.
- Put a confidence score on every path now, even a rough one, so the discipline is already in place before the models get better.
Over the next twelve months, pay attention to outcomes, not claims. Don't take a vendor's word for how good their AI is at finding attack paths, check it against your own validation results. When one of their AI flagged paths goes through validation, keep track of how often it turns out to be real versus a dead end. That's the number that actually tells you whether their AI is helping or just adding more noise to the pile, and it's something you can measure yourself, not something you have to take on faith. Watch whether that accuracy improves quarter over quarter, and whether the time between an inferred path and a validated one keeps shrinking. Watch one more number outside your own program too: how fast a working exploit shows up after a vulnerability is disclosed. That's the clock your prioritization process is racing against, and it's getting shorter, not longer.
Over the next twelve months, pay attention to outcomes, not claims.
So, all the world's a graph?
Not literally, and it never will be. You will not achieve perfect, real time observation of every path through a modern enterprise, and chasing that as the goal is how programs burn budget on network mapping projects that are stale before they finish. The realistic goal is a graph that is directly observed where it counts most, reasonably inferred everywhere else, and clear about which parts are which. That's what actually replaces the league table, not a better severity score, a graph good enough to answer can this be exploited, can it be reached, and what does it touch, with a confidence level attached to every answer.
A severity score tells you how bad something looks. A graph, built and inferred with real data, tells you how likely it is to matter. Ranking a program by the first one was always a workaround for not having the second. That workaround is running out of excuses.
Want to see which of your paths are actually reachable?
FAQs
Attack path analysis maps how an attacker could move from a plausible starting point to a valuable asset by chaining exposures, identities, and network connections. Instead of rating each vulnerability on its own, it shows which weaknesses sit on routes that actually lead somewhere, so teams fix what an attacker could use first.
CVSS rates how severe a vulnerability is under ideal conditions, but it knows nothing about your environment. A 9.8 on an isolated system with no path to anything valuable can matter less than a 6.5 on the route into your identity provider. Prioritizing by real risk means adding exploitability, reachability, and blast radius.
Exploitability asks whether a weakness can be triggered on a specific asset, given what's running and what privileges it needs. Reachability asks whether an attacker can get to that weakness at all. Blast radius asks how far an exploit would spread and what it would touch. Together they turn severity into risk.
Breach and attack simulation runs a fixed library of known techniques against your controls on a schedule, which tells you whether known attacks still get caught. Autonomous pentesting maps your specific network fresh on each run and chains what it finds, which tells you what an attacker could actually do right now. Most mature programs use both.
Track how often AI-flagged paths turn out to be real when they go through validation, and whether that rate improves quarter over quarter. Also measure the time between an inferred path and a validated one. These are outcomes your own program can measure, rather than accuracy claims you have to take from a vendor.
Check vendor claims against your own validation results. Track how often AI-flagged paths turn out to be real, whether that accuracy improves quarter over quarter, and how quickly inferred paths get validated. Those are numbers you can measure yourself rather than take on faith.
Most already hold what a network rebuild would produce, scattered across CMDBs, cloud inventories, identity systems, and scanners. Normalizing and inferring over that existing data beats fresh collection. Full rebuilds stay reserved for segments where a wrong answer is existential, such as core banking or identity infrastructure.