The 5 Stages of CTEM, and What Each One Demands From Your Data
by Marcela Ricci, Director of Integrated Marketing//
What is CTEM?
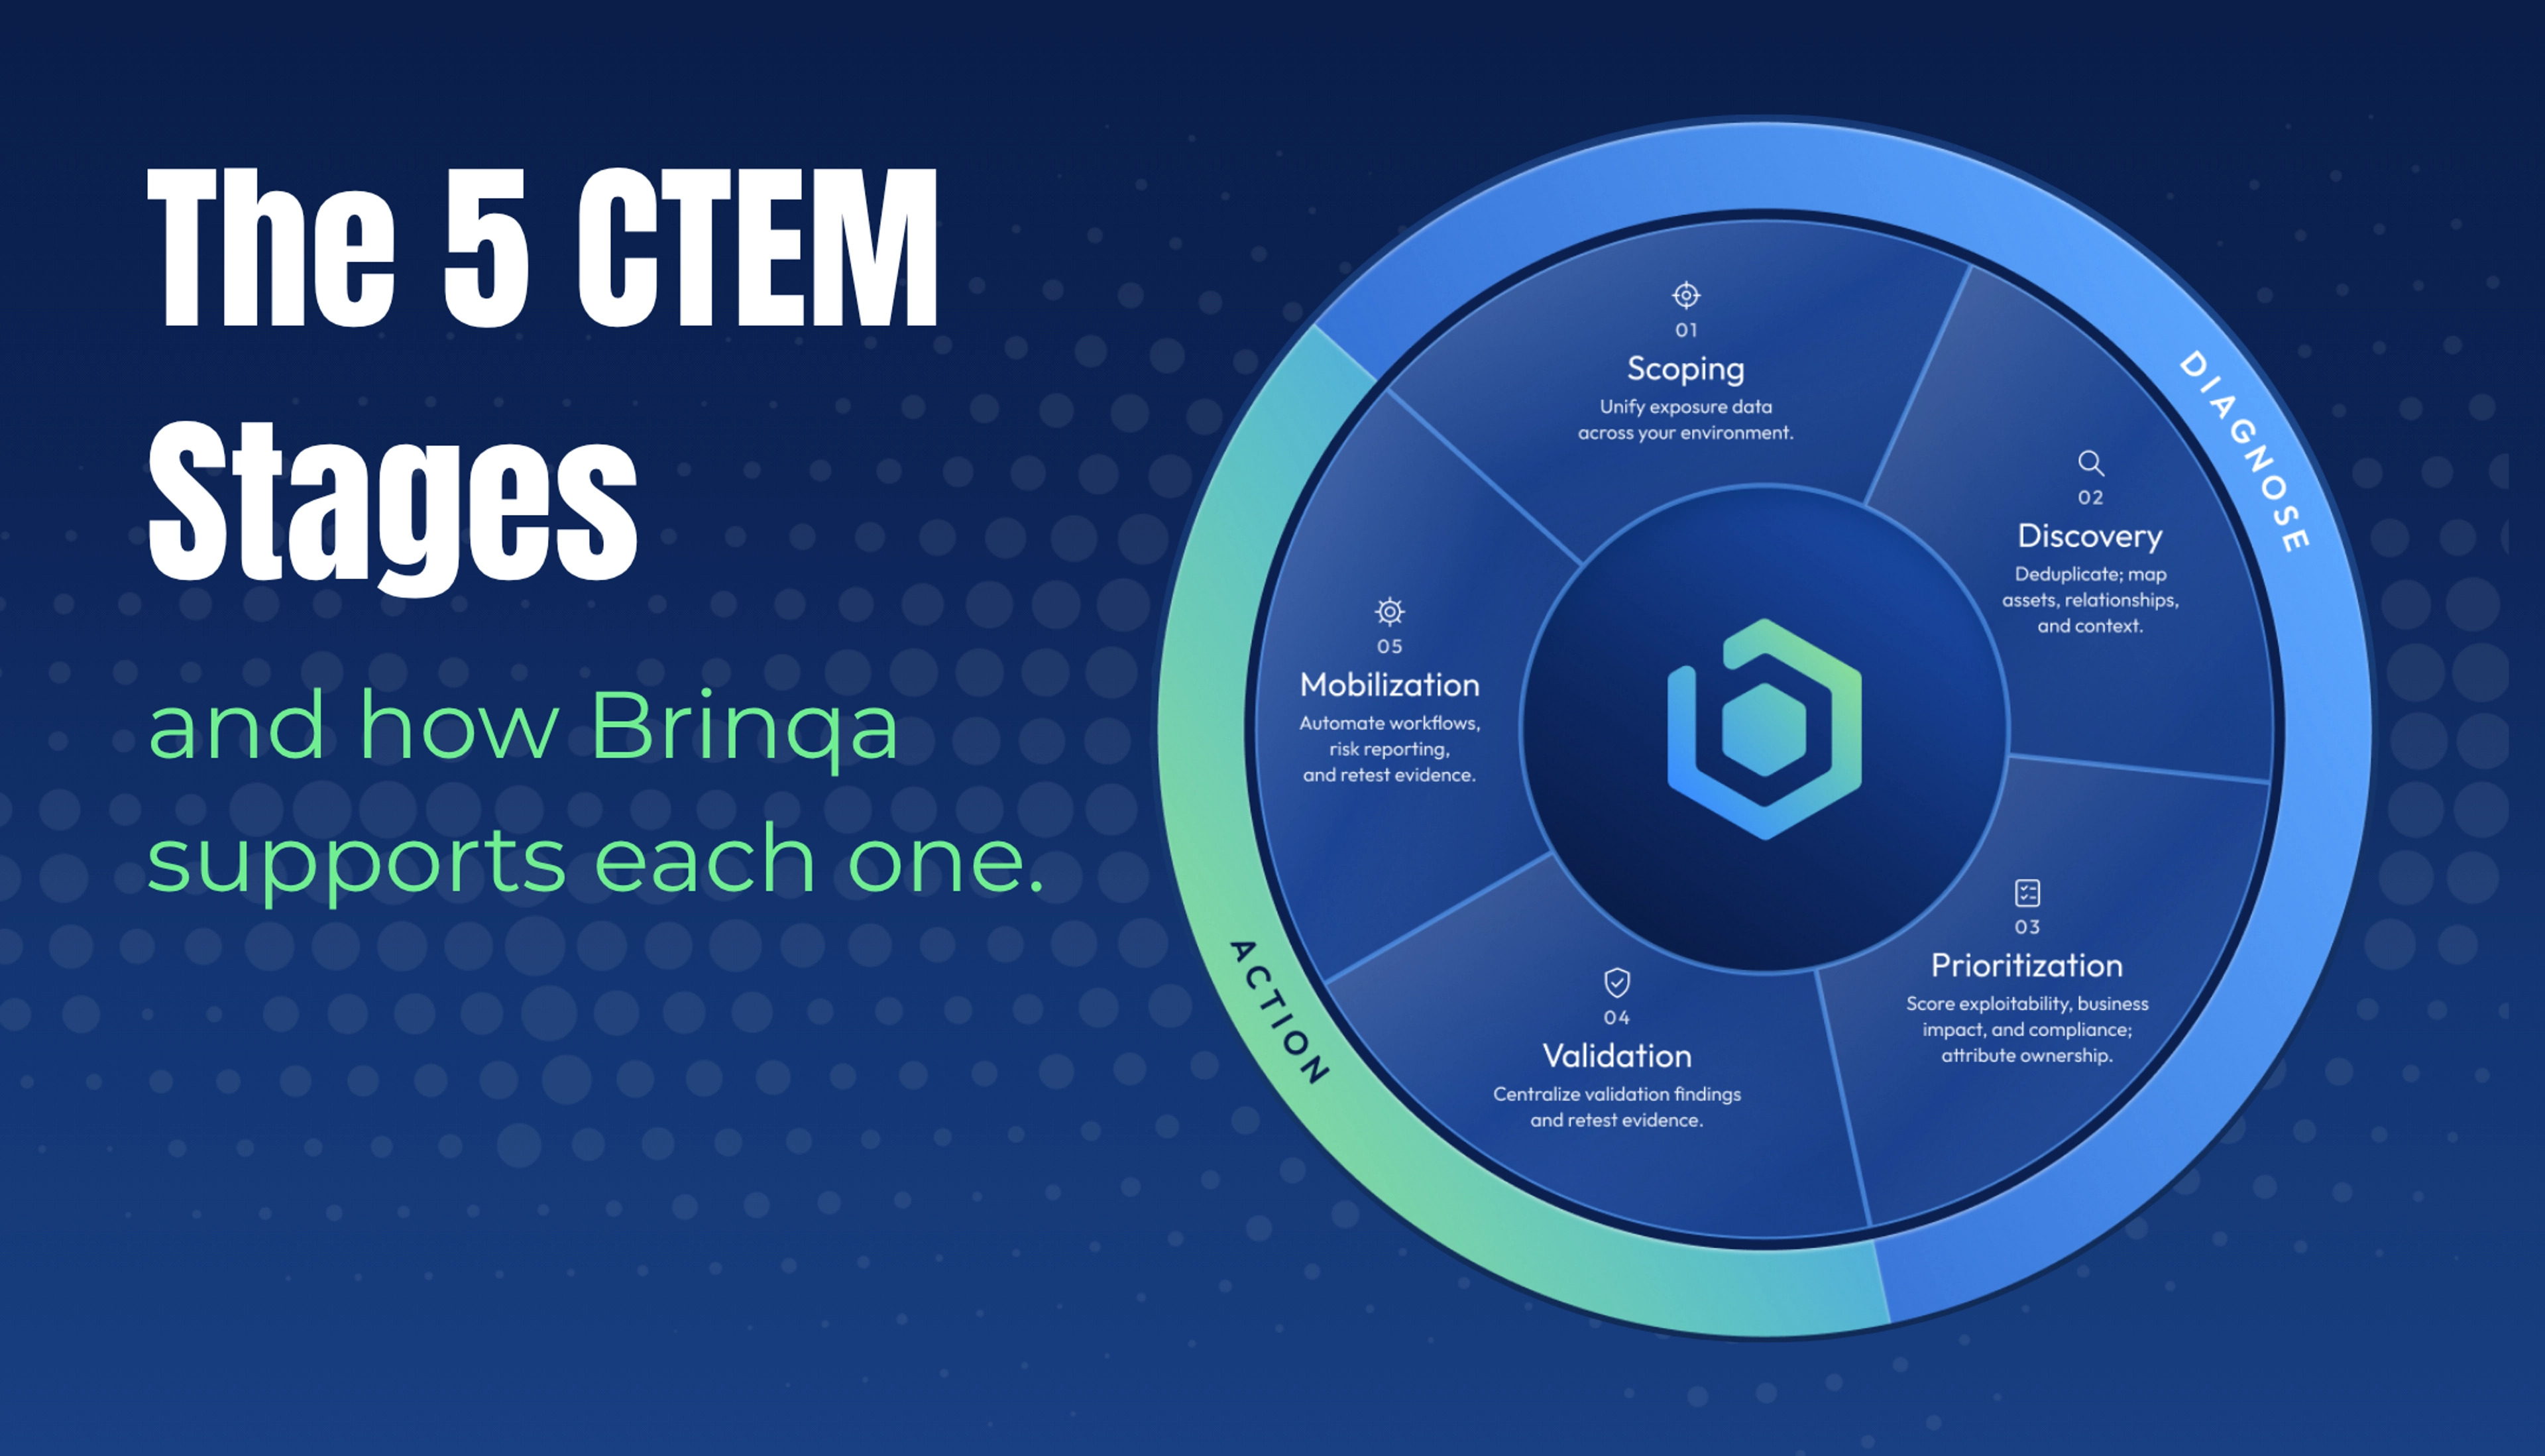
Continuous threat exposure management (CTEM) is a security program that continuously finds, ranks, tests and fixes the exposures that matter most to the business. Gartner introduced it as a five-stage cycle: scoping, discovery, prioritization, validation and mobilization. Each stage asks a different question of the same exposure data, and programs tend to stall at the stage where that data runs out.
The framework is easy to agree with and harder to run, because each stage depends on what the stage before it produced. A prioritization model can't rank an asset that discovery never found. Mobilization can't route a fix to an owner nobody recorded.
For each stage below, you'll find the question it answers, the data it needs, where programs commonly get stuck, and where Brinqa fits. Brinqa, the exposure management platform, supports all five stages. The first three stages diagnose your exposure, and the last two act on it.
The five stages of the CTEM framework
1. Scoping: what matters most to the business right now?
Scoping defines which exposure domains the program covers, ranked by business priority. Revenue-generating services, regulated environments, critical assets and internet-facing infrastructure usually come first.
What it needs from your data: business context attached to technical assets. You need to know which application a server supports, which service depends on that application, who owns it, and which regulations apply to it.
Where it stalls: scoping done once, as a static list, while the business keeps changing. New cloud accounts, acquisitions and reorganizations all shift what matters, and a scope built from one tool's view of the environment misses whatever that tool can't see.
Where Brinqa fits: The Brinqa Platform unifies exposure data from across your environment, integrating with more than 300 security and IT tools. Findings from your tools come together in Platform’s data layer, powered by the Brinqa CyberRisk Graph™, giving you one clear view of the environment to scope against.
2. Discovery: what exposures exist across everything in scope?
Discovery continuously identifies assets, vulnerabilities, misconfigurations, identity exposures and application weaknesses across cloud, on-premises, code and third-party dependencies.
What it needs from your data: coverage without gaps, and one identity per asset. When a scanner, a cloud platform and an asset inventory each name the same host differently, you have three records for one problem.
Where it stalls: blind spots and duplicates. Shadow IT, short-lived containers and code repositories nobody inventoried never reach the prioritization model. Meanwhile, overlapping tools inflate the backlog with the same finding several times over. For more on this problem, see the CTEM challenge of too many tools and too little integration.
Where Brinqa fits: Once the Brinqa data layer ingests findings from your scanners and tools, the AI Layer fills data gaps, merges duplicate findings, and enriches exposure intelligence – so your team works with cleaner, more complete data. Transparent, explainable, and built to keep humans in control.
The CyberRisk Graph then maps each asset's relationships to applications and services, so every exposure carries its business context into prioritization.
3. Prioritization: which exposures carry the most real risk here?
Prioritization decides which exposures deserve attention first. That takes more than a severity score.
What it needs from your data: exploit intelligence such as CISA Known Exploited Vulnerabilities (KEV) status and EPSS scores, plus asset criticality, network exposure, compensating controls, business impact and compliance requirements. Where you have them, results from offensive security testing are the strongest signal of all.
Where it stalls: CVSS-sorted lists. A critical CVSS score on an isolated internal system with no path to sensitive data is a smaller problem than a medium score on an internet-facing authentication service that handles customer credentials.
Where Brinqa fits: Brinqa's risk-scoring engine scores every exposure in the CyberRisk Graph™ on exploitability, business impact and compliance, using the context gathered in discovery. That's how a medium-severity flaw on a customer-facing payment service can rightly outrank a critical one on a test server. Every ranking is explainable.
The AI Attribution Agent then fills the data gaps that would otherwise stall remediation, predicting missing attributes such as owner, business unit, environment and asset criticality, so the highest-risk work is ready to route.
4. Validation: did the fix hold?
Validation confirms that remediation worked. A closed ticket shows that someone marked the work done. Validation retests the exposure to show whether the attack path is actually gone.
This matters more as teams move to two-step remediation: block the attack path first with a mitigating control, such as a firewall rule or a tightened permission, then apply the patch on the normal change cycle. Each step needs proof that it held, including weeks later, after configurations have drifted.
What it needs from your data: offensive security testing and retest results linked to the same exposure records as your scanner findings, so each retest confirms or reopens a specific exposure.
Where it stalls: validation runs as an occasional exercise whose findings end up in a report nobody connects to the backlog, and closure measured by a ticket status change.
Where Brinqa fits: PlexTrac by Brinqa centralizes validation findings and retest evidence from your testing tools and teams, and keeps each retest result attached to the original finding. A ready-built connector brings that evidence into the CyberRisk Graph, so verified status updates the exposure record directly. Over time, the share of fixes that hold on retest gives you a clear measure of whether remediation is working.
5. Mobilization: who fixes it, by when, and how do you know it's done?
Mobilization turns decisions into coordinated, governed remediation across security, IT and development teams.
What it needs from your data: the owner assigned during prioritization, ticket and exception history, related findings on the same asset that belong in one work item, and retest results to confirm closure.
Where it stalls: tickets that reach the wrong team, arrive three times from three scanners, or carry no context about existing controls. Once teams learn to distrust the queue, the whole program slows.
Where Brinqa fits: In the Platform’s orchestration layer, Brinqa's SmartFlows automates the remediation workflow. It opens tickets in your IT service management tool, tracks them to closure, and feeds risk reporting for leadership. Verified closures feed back into prioritization, and the cycle returns to scoping.
The five stages at a glance
| Stage | Question it answers | Data it needs | Common failure point | Where Brinqa fits | |
|---|---|---|---|---|---|
Scoping | What matters most to the business right now? | Asset-to-application-to-service relationships, owners, regulatory scope | A static scope that stops tracking the business | Brinqa unifies exposure data across 300+ scanners and tools, maps assets to applications, business units and owners – so scope reflects real business priorities. | |
Discovery | What exposures exist across everything in scope? | Full coverage and one normalized identity per asset | Blind spots, data gaps, and duplicate findings | Brings in findings from scanners, cloud and application security tools, and deduplicates them in the CyberRisk Graph™ while keeping the original source data. | |
Prioritization | Which exposures carry the most real risk here? | Exploit intelligence, asset criticality, exposure, controls and compliance | CVSS-only ranking | Brinqa ranks each exposure using business context and threat intelligence, so teams start with the highest risk. | |
Validation | Did the fix hold? | Testing and retest results linked to exposure records | Findings stuck in reports; closure by ticket status | Brinqa checks each fix against the latest results from connected scanners and testing tools, while PlexTrac by Brinqa tracks retest results from penetration tests and red team exercises, so every closed exposure has evidence the fix held. | |
Mobilization | Who fixes it, by when, and is it done? | Ownership, ticket history, related findings, retest results | Wrong owners, duplicate tickets, no verified closure | Brinqa routes each exposure to its owner, opens tickets in the tools teams already use and tracks remediation against SLAs, while Plextrac delivers clear, consistent reports and remediation guidance to the teams doing the work. |
Find the stage where your data runs out
Most CTEM programs have at least one stage that the data underneath can't support yet. Trace one critical exposure through all five stages this week, and note where it loses its owner, its context or its proof of closure. That stage is your next investment.
For the full framework, a maturity model and practical recommendations, download the CTEM Practitioner's Guide.
If you'd like a second pair of eyes, meet with a Brinqa expert. We'll trace one of your own critical exposures through all five stages with you, show where your data runs out, and walk through how Brinqa fills those gaps.
FAQs
Scoping, discovery, prioritization, validation and mobilization, as defined in Gartner's CTEM framework. The cycle repeats continuously, with verified outcomes from mobilization informing the next round of scoping.
Traditional vulnerability management scans on a schedule and works through a severity-sorted backlog. CTEM runs continuously and asks which exposures represent real risk to your organization right now, and in what order to address them. For a fuller comparison, see CTEM vs vulnerability management vs exposure management.
No. CTEM is a program that runs on an ecosystem of tools: scanners, asset discovery, attack surface management, threat intelligence and testing. Its value depends on connecting those tools into one consistent view of exposure, which is what a CTEM platform is for.
Brinqa supports all five stages. It unifies exposure data, removes duplicates and maps assets and their context, then scores each exposure on exploitability, business impact and compliance. Brinqa's remediation workflows route each fix to the right team, and once the work is done, PlexTrac by Brinqa brings in the retest evidence that shows whether the fix held, with risk reporting tracking progress throughout.
Support for all five stages from one data foundation. A strong platform connects to the tools you already run, removes duplicates without losing source data, explains every priority ranking, proves that fixes held, and routes work to owners in the tools they already use. When you compare CTEM vendors, ask each one to trace a single exposure from discovery to verified closure. Any gaps show up quickly.
With the data foundation. Connect your primary vulnerability scanners and asset inventory first to get one normalized view of assets and findings, then add risk-based scoring, automated routing and validation in that order.
Report outcomes: validated risk removed, the share of fixes confirmed on retest, and SLA performance by team. Each figure should trace back to the same data your remediation teams work from, so every follow-up question has an answer.